LES Simulation of a Buoyant Plume
The second part of my master thesis consisted of performing an LES simulation of a buoyant plume and developing an energy framework in an open volume to study the pathways in which the mechanical energy is transformed into this system. Using this framework, we were able to estimate a mixing efficiency of the plume of ∼ 0.7.
Vent discharges form turbulent buoyant plumes as they ascend the water column. These plumes entrain cold surrounding water as they rise, diluting the plume continuously with ambient fluid. If the plume is in a homogeneous environment, the plume will ascent indefinitely or until it reaches the surface. However, in a stratified environment, the rising plumes will decrease their density, until they reach an equilibrium level in which the plume will stop rising and will start spreading laterally (Lupton, 1995). Plumes occur in a wide range of scales in the ocean and the atmosphere, but in general, they are an important mechanism for the dispersal of chemicals and thermal fluxes, as well as they can disperse material.
Video 1: Plume experiment marked by the control volume.
Methods
To complement the analysis of the turbulence surrounding the hydrothermal vents, we performed a 3D idealized simulation of a buoyant plume in a stratified medium.
When designing the experiment, we found that stratification was straightforward to implement in a simplified model, by setting adequate boundary conditions and an initial stratification profile. Also, it is straightforward to include rotation in the experiment, just by including the Coriolis term in the equations of motion, although in the analysis we found that the inclusion of the rotation term prevents of having a stable state in the plume, making difficult to implement the energy framework analysis. Other forcings like the internal tides are difficult to implement in an idealized model, so it was not considered for this experiment.
The objective of the experiment was to compute the energy budget of the plume, by computing the fluxes of energy between the mechanical energy reservoirs \(E_a\), \(E_b\) and \(K\). To achieve this objective, we developed a set of tools to diagnose these quantities by integrating the quantity of interest in a control volume or through this control volume. Also, these tools had to deal with the numerical technicalities associated with the model, such as the interpolation of the staggered grids and reading the subdomain outputs.
Numerical set-up
The simulation was performed using Nyles, a newly created LES code developed by Prof. Guillaume Roullet, Markus Reinert. The model uses an implicit turbulent closure, which consists on representing the subgrid physics relying on its own intrinsic dissipation, i.e. there is no explicit term for the viscous dissipation, instead, the dissipation it is done by upwinding the vorticity in the vortex force term, which shows up in the covariant form of the Navier-Stokes equation. The code is still under development but is already fully functional. This simulation was a test for the code and its versatility. This work didn’t involve any development or contribution to the mentioned model. The implementation of the plume model was done at a user level.
The simulation has a resolution of \(32\times64\times64\), in a domain of \(2000m\times4000m\times4000m\) (following the \(z,y,x\) convention). The solved variables were buoyancy \(b\), velocity \(\vec{u}\), and pressure \(p\). We solved buoyancy instead of solving for temperature, salinity, and density because it simplifies the computations by condensing the dynamics for all the state variables into one. The domain has fixed boundaries. We set a volumetric buoyancy forcing \(F_b\), as a 3D Gaussian distribution, with a radius of 20m (1% of \(L_x\)). The buoyancy gets injected in a way that the maximum buoyancy is located at the bottom-center of the domain, and it fades with height, spanning just a couple of vertical levels. Horizontally, the buoyancy fades away from the center. We set \(F_b = 6.25\times 10^{-8}m^2 s^{-3}\), which is equivalent to a surface heat flux of \(Q=127Wm^{-2}\). We didn’t establish an exit velocity to simulate a forced plume exiting a single hydrothermal vent, instead, we assumed that we are simulating a plume at a level in which the rising motion is dominated by buoyancy and not by momentum. The background stratification was set to be linear, with \(N^2\) = \(5\times 10^{-6}s^{-2}\).
The convection experiments in a stratified environment are known for generating internal gravity waves by the interaction of the buoyant plumes with the upper stratification (Couston et al., 2018). In a box model, the internal waves propagate in the environment and can be reflected by the boundaries, which can cause interference with the flow and with its energy balance. To avoid this scenario, we implemented a sponge layer or nudging in the lateral and top boundaries, in which the velocity and internal waves are damped, avoiding their reflection. Another problem solved with the lateral boundary conditions is that the buoyancy builds up in the domain as time passes, changing the background stratification. This happens because we inject heat in the lower boundary but it never exits the domain. To keep the stratification unchanged, we introduced a buoyancy sink in the lateral boundaries in a way that the cooling balanced the heating done by the source term. In the case with rotation, the buoyancy gets trapped in a vortex that builds-up with time, modifying the plume dynamics and the heat budget. This was the main reason why we didn’t include rotation in the experiment.
Video 2: Plume experiment with rotation.
Control Volume Determination
The first step towards the implementation of the energy framework was defining a control volume that includes the whole plume in such a way that the flux through the boundaries in the control volume is minimized. We defined this volume as a cylinder, with its center at the source of buoyancy. The radius of the cylinder can go from 0.2 up to 0.4 of the horizontal length \(L_x\), to make sure that the whole plume is contained and to avoid the sponge boundaries. To determine the optimal radius, we computed the lateral mass flux in the cylinder for different radius the mentioned range. We opted for \(r=0.35\) because of the variation of its lateral mass flux similar to \(r=0.4\), the smallest one, and puts the volume farther from the sponge layers. The height of the volume was determined by estimating vertical momentum flux at different levels. The height to the control volume was defined where the momentum flux was 10% of the maximum flux of all levels. On average this level corresponded to a height of 60% of the vertical domain.
Diagnostics
To compute the energy in the reservoirs and their corresponding fluxes, we defined a set of integration methods specifically defined for the cylinder volume. We computed the local quantities that define the fluxes and reservoirs, and we integrated according to its role in the energy framework. In particular, to compute \(E_a\) and \(K\) we integrate over the volume the local available potential energy and the kinetic energy:
\begin{equation} E_a = \frac{1}{V}\int_V \frac{\left(b - b_r(z)\right)^2}{2N_r^2} dV \quad \text{and} \quad K = \frac{1}{2V}\int_V \left ( u^2 + v^2 + w^2 \right ) dV, \end{equation} where \(V\) is the control volume, \(b\) is the buoyancy, \(b_r\) the background buoyancy, \(N_r\) is the background Brunt-Vaisala frequency, and \(u,v,w\) are the velocity components.
The fluxes \(\phi_z\), \(\phi_b\) were integrated over the volume, the flux \(\phi_p\) was integrated only on the top surface of the cylinder, and \(\phi_e\) was integrated on the surface, except for the source of potential energy imposed at the bottom \(F_b\), because we defined it as a volumetric forcing.
To compute the mixing efficiency \(\varepsilon\), the plume needs to reach its equilibrium state with the environment, in which the energy content of \(K\) and \(E_a\) remains practically constant through time. We cannot compute \(\varepsilon\) using the dissipation terms \(\epsilon_k\) and \(\epsilon_a\), because we cannot directly estimate these terms from the simulation.
Instead, we assumed a steady state, where \(\partial_t K \approx 0\) and \(\partial_t E_a \approx 0\), therefore we can redefine the mixing efficiency as \begin{equation} \mathcal{E} = \frac{\phi_b-\phi_z}{\phi_b+\phi_p}. \label{eq:mix_efficiency} \end{equation} This equation allow us to compute the mixing efficiency in a numerical simulation of a plume in its steady state, by computing the fluxes \(\phi_b\),\(\phi_z\) and \(\phi_p\), which are the principal mechanical energy pathways in the plume system.
Results
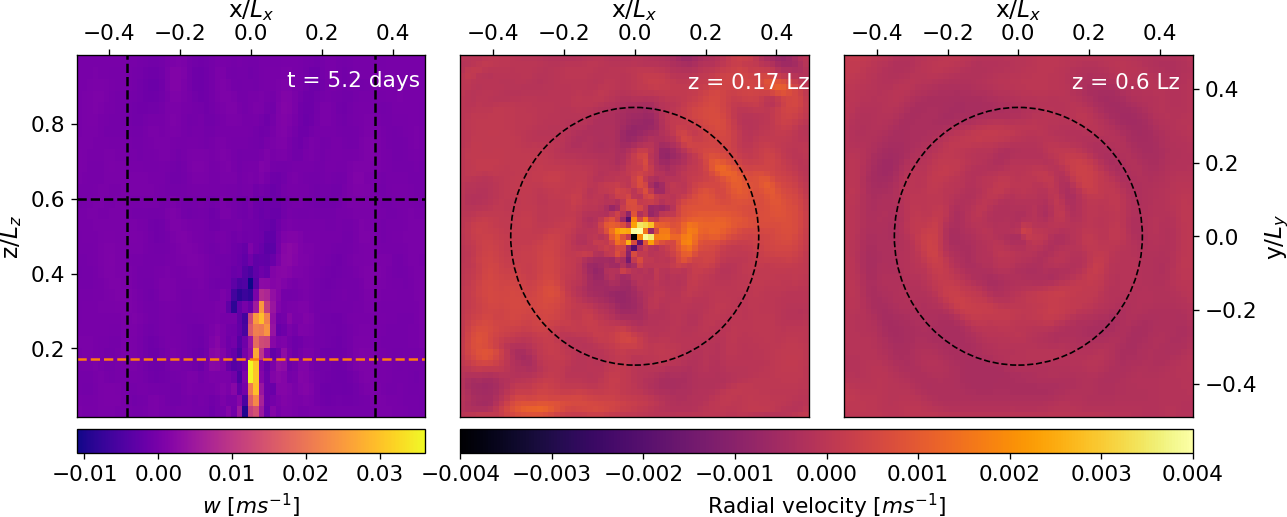
We integrated the plume for a time equivalent to 10 days, to let the plume reach its steady-state. In Figure 1 we show a snapshot of the plume in its stable state, reached after four days of simulated time. The height of the plume is ~1000m, the height where the vertical velocity vanishes. In the top view plots (center and left), particularly the horizontal transversal section at \(z = 0.17 \ L_z\), we see how the radial velocity of the plume is mainly positive, confirming that the plume extends radially as it goes up. At the top of the control volume \(z = 0.6 \ L_z\) , we no longer see the plume structure, instead, we see that the radial velocity oscillates around zero indicating the presence of internal waves generated by the plume bellow. The plume structure remains practically the same for the following days, only changing slightly because of turbulence.

Figure 1: Snapshot of the plume at day 5, in its stable state. At the left, we show the vertical velocity \(w\) in a vertical cut of the domain done at \(y/L_y=0\). The black dotted lines indicate the limits of the control volume. At the center, the radial component of velocity in a transversal section at \(z=0.17 \ L_z\) indicated as the orange line in the left panel. At the right the radial velocity at \(z=0.6 \ L_z\), the top of the control volume.
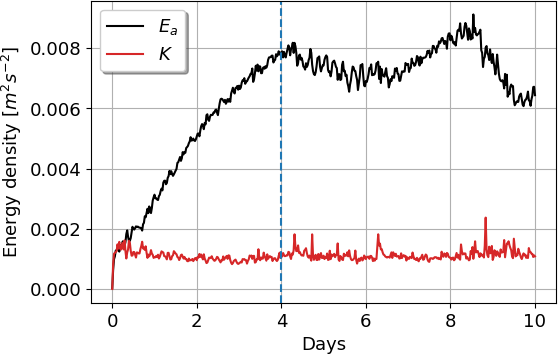
We computed \(E_a\) and \(K\) for all the duration of the simulation, to determine the time from which the plume becomes stable. In Figure 2, at the left panel, we display the curves that correspond to the energy per unit of volume of both reservoirs. We see that \(K\) reaches an stable equilibrium after one day of simulation, oscillating around a mean value of \(1.1\times 10^{-3}m^2s^{-2}\), with a corresponding standard deviation (STD) of \(1.6\times 10^{-4}m^2s^{-2}\). For the \(E_a\) we see that the energy builds up until the 4th day, when the trend changes and \(E_a\) oscillates around a mean value of \(7.5\times 10^{-3}m^2s^{-2}\) with an STD of \(6.3\times 10^{-4}m^2s^{-2}\). The long transient state of \(E_a\) is due to the small buoyancy fluctuations that build-up at the start of the simulation until the sponge layers can compensate more effectively for this accumulation. The stabilization of \(E_a\) was our criterion for establishing the time at which the stable state was reached. To assure that the energy framework is adequate for our experiment, we computed to surface flux of \(K\) and \(E_a\). We found that the surface flux of \(K\) is practically zero for all time and the surface flux of \(E_a\) on average is zero. Therefore, we can assume that the framework defined for the plume holds.


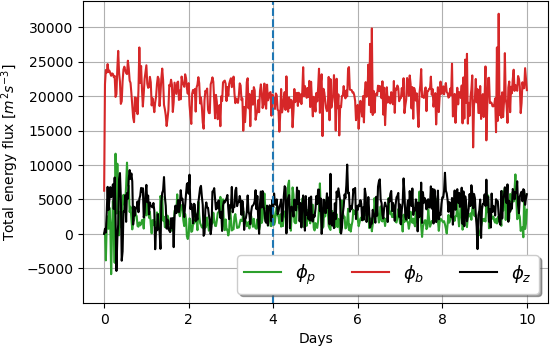
Figure 2: On the left, the available potential energy \(E_a\) reservoir and the kinetic energy reservoir \(K\), for all time. The blue dotted lines in both plots indicate the start of the stable state of the plume. On the right, the estimates of the energy fluxes \(\phi_p\), \(\phi_b\), and \(\phi_z\).
On the right panel in Figure 2, we show the comparison between the total flux \(\phi_p\), \(\phi_b\), and \(\phi_z\). \(\phi_b\) is the energy that is being transformed from the background potential energy \(E_b\) to APE, per unit of time. This flux has a mean value of \(2\times 10^{4}m^2s^{-3}\) and it quantifies the conversion that takes place inside all the control volume. The APE of the system gets converted to \(K\), by the \(\phi_z\) flux with a mean value of \(4.1\times 10^{3}m^2s^{-3}\). From the kinetic energy, almost all of it is radiated to the wave field via the term \(\phi_p\) with an average value of \(2.5\times 10^{3}m^2s^{-3}\). This suggests that 60% of the newly created kinetic energy gets irradiated to the internal wave field, and the 40% remaining is dissipated by \(\epsilon_k\), which has an average value of \(1.6\times 10^{3}m^2s^{-3}\) (recalling that the flux of kinetic energy through the boundaries of the control volume is zero).
Acknowledgments
Thanks to Prof. Guillaume Roullet for his support and help to finish this project. This post it’s just an excerpt of my master thesis.
References
- Couston, L.-A., Lecoanet, D., Favier, B., and Le Bars, M. (2018). The energy flux spec- trum of internal waves generated by turbulent convection. Journal of Fluid Mechanics, 854.
- Lupton, J. E. (1995). Hydrothermal plumes: near and far field. GMS, 91:317–346.