Abyssal Turbulence in the Vicinity of Lucky Strike
The objective of this study was to analyze observations from the mooring anchored to the South-West of the Lucky Strike volcano, to identify the different processes that occur over Lucky Strike, such as internal tides or passing mesoscale eddies. Also, the 9 years of data collected for the mooring allow us to see if there is interannual variability in this region.
Lucky Strike is a vent field or system that was discovered by chance by the French-American Ridge Atlantic (FARA) program in 1992. During that expedition, a dredge brought on deck sulfide deposits covered with living organisms, characteristic of hydrothermal vent fields, indicating the possible existence of a vent field in that position. This discovery was confirmed later in 1993, with several immersions done with Alvin the submersible. The name Lucky Strike is due to this fortuitous discovery (Langmuir et al., 1997).
The vent field is located in the Mid Atlantic Ridge (MAR) between 37°3′N and 37°37′N, 400 km southwest of the Azores Islands, and the Azores Triple Junction (see Figure 1). The rift valley where the vent field is located is known as the Lucky Strike Segment. This segment is 60 km long and 10 km to 15 km wide, bounded by 1000 m high axial valley walls. At its center, the segment shallows (~1700 m deep) due to the presence of the Lucky Strike volcano (Ondréas et al., 2009).
Lucky Strike is one of the largest axial volcano within the rift valley on the MAR (see Figure 1) and hosts the highest diversity of species of all the vent systems in slow-spreading ridges. At its center, in the caldera, there is a young solidified lava lake about 200 m wide, which is the place that has hydrothermal activity. In Lucky Strike there are 30 vents sites distributed over a 1 km2 area (Karson et al., 2015). The plume has an estimated height of ∼100 m, with a total heat flux of 3800 MW ± 1200 MW (Jean-Baptiste et al., 2008)
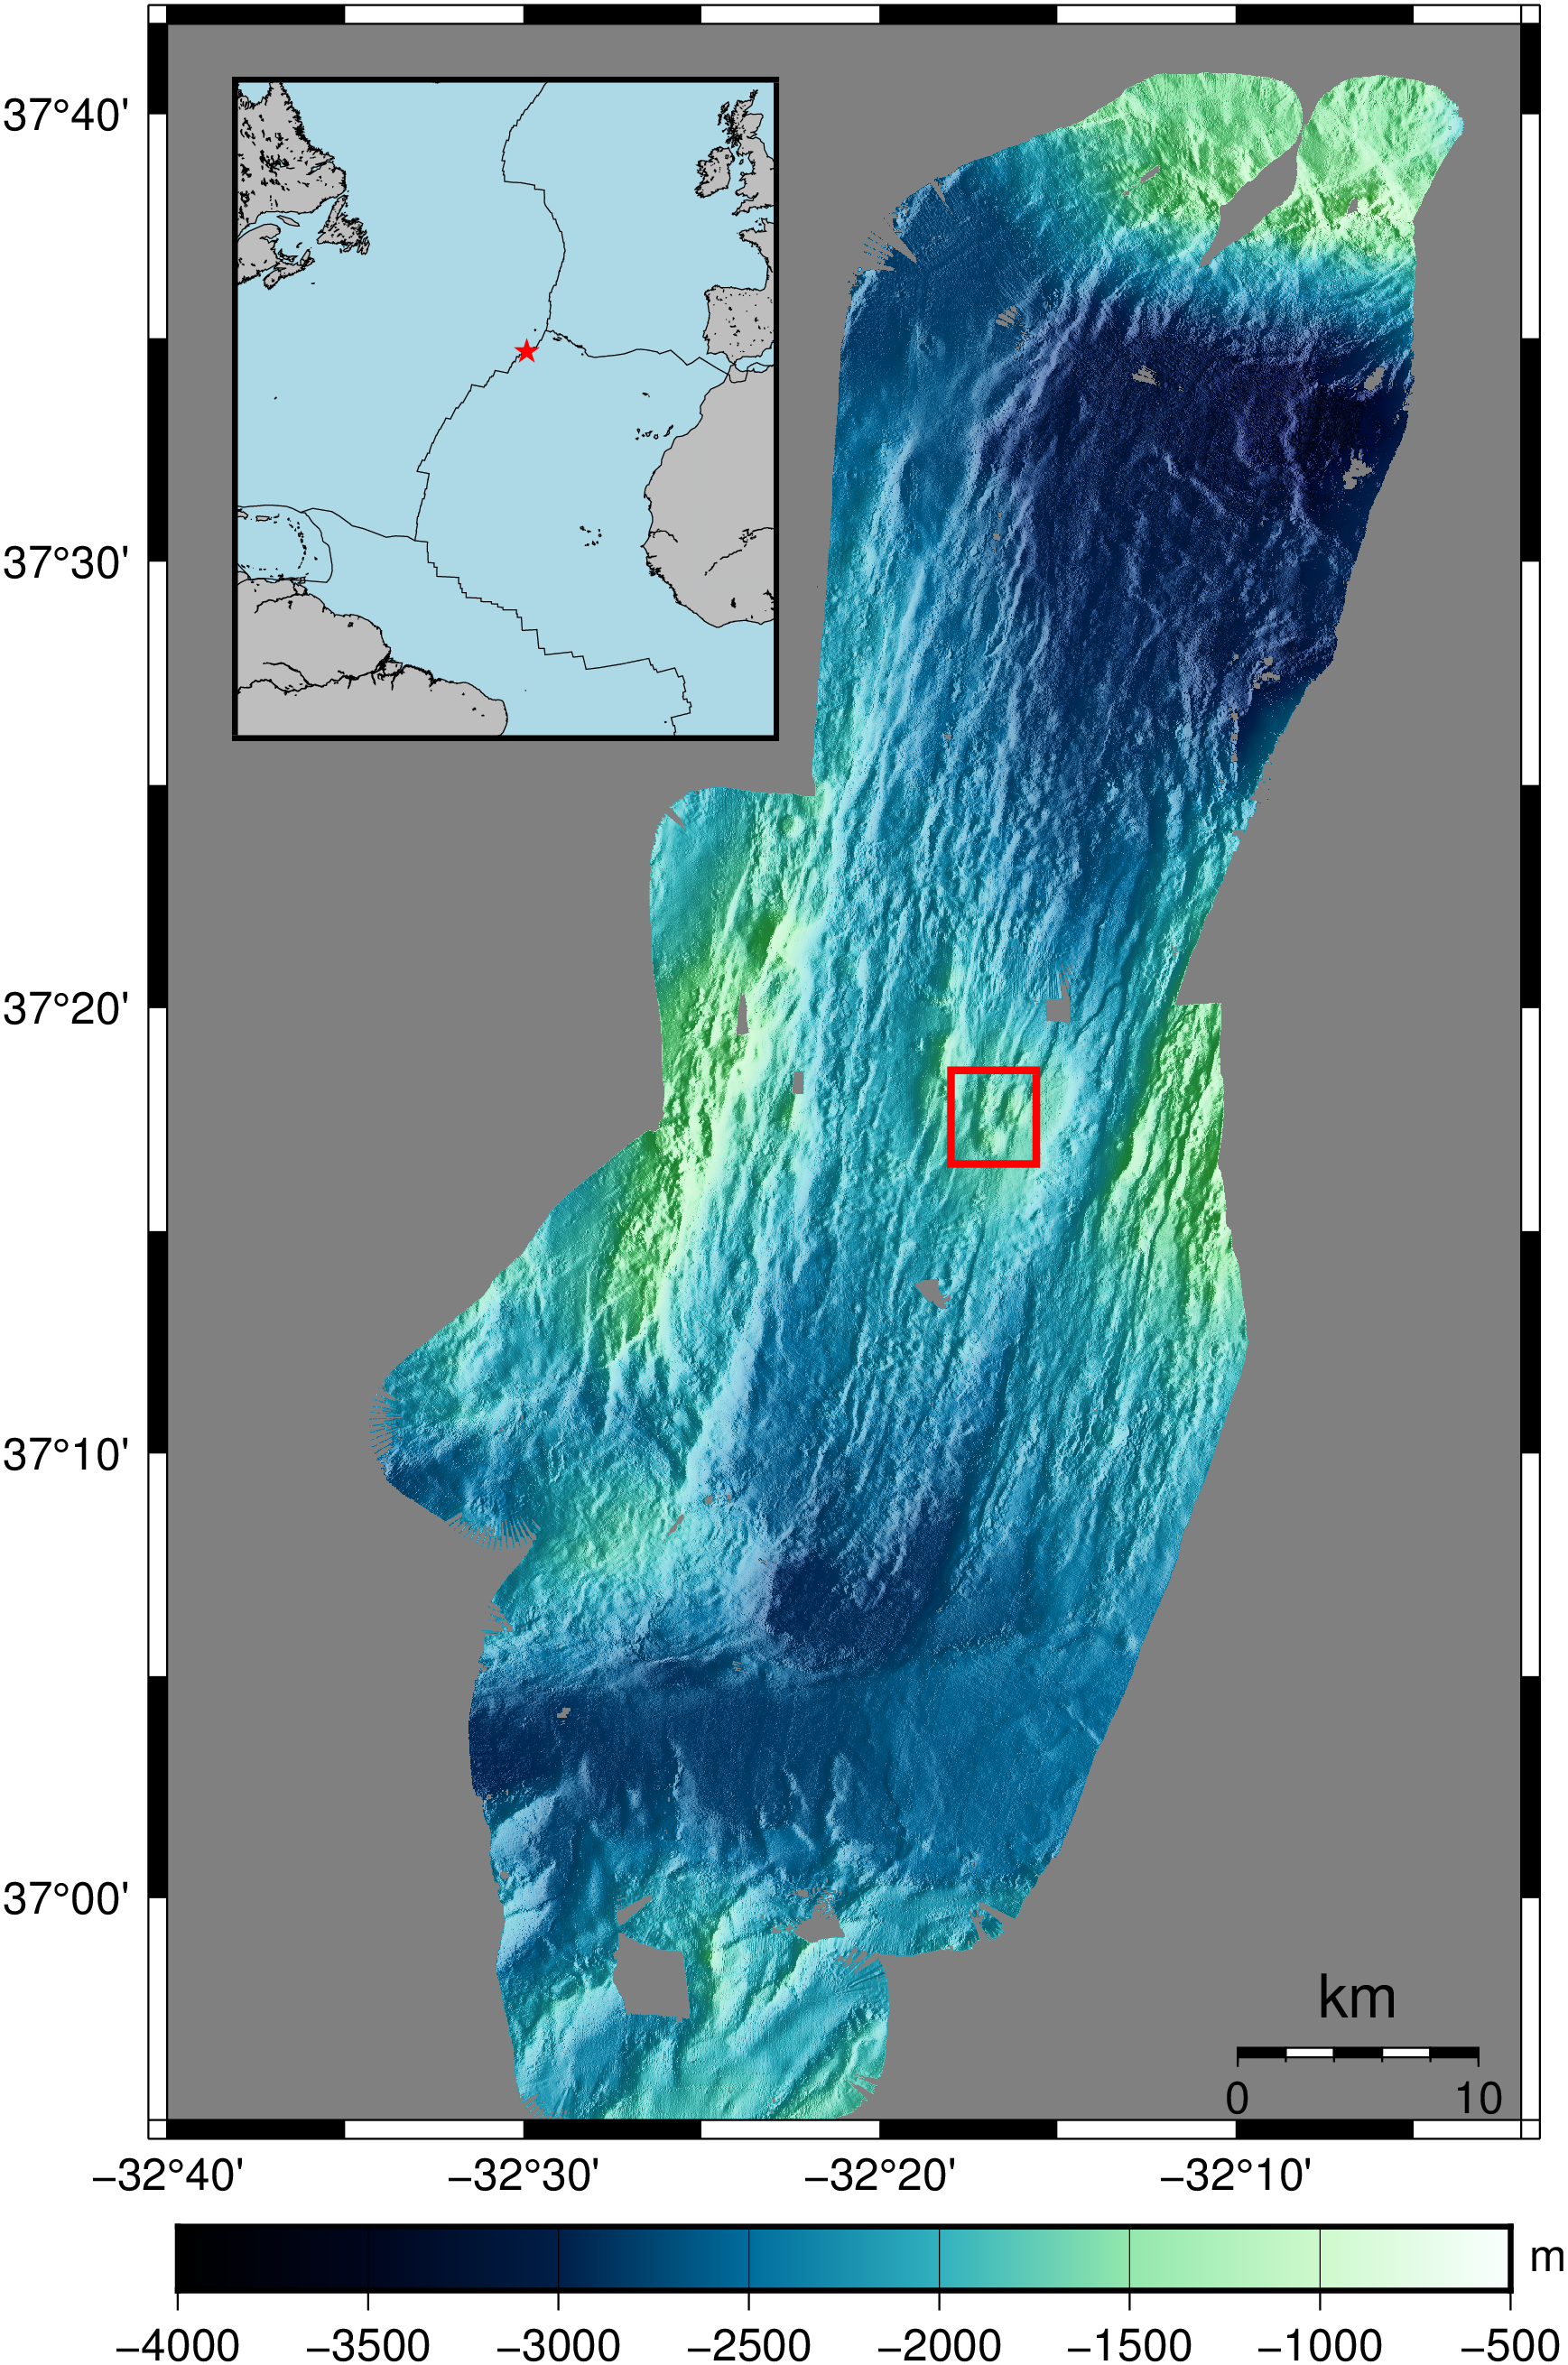
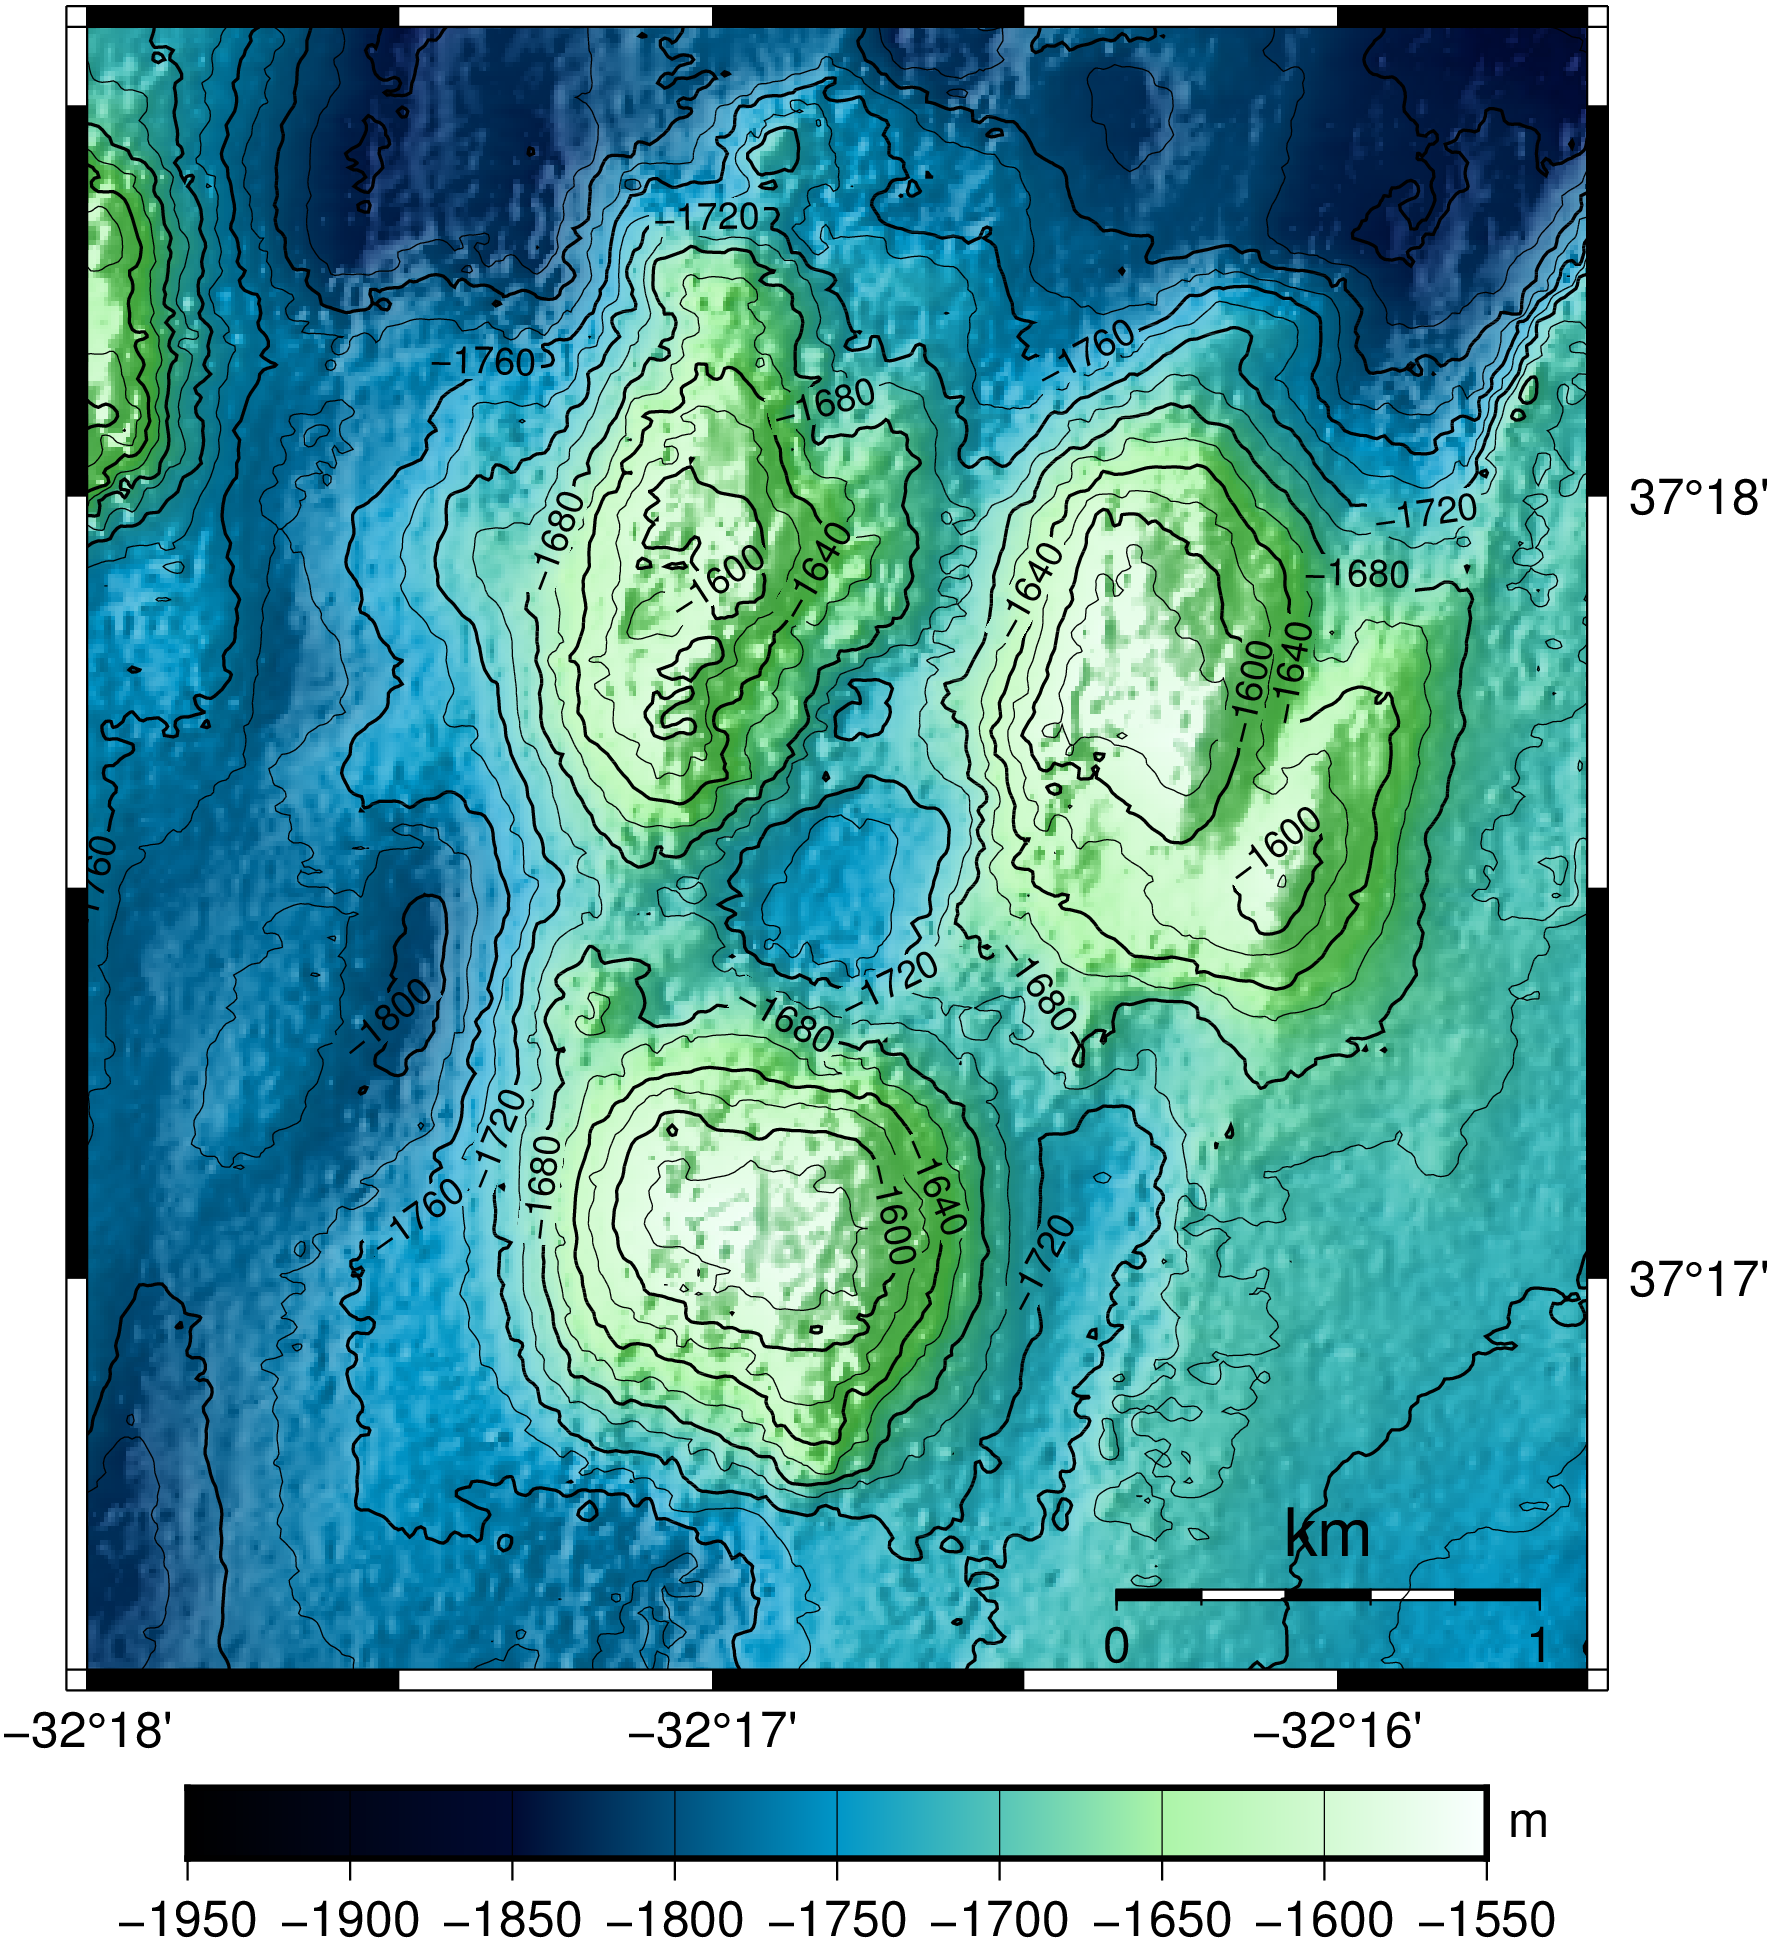
Figure 1: At the right, the bathymetry of the Lucky Strike segment placed at the Southwest of the Azores triple junction in the MAR. The Red square represents the location of the Lucky Strike volcano. On the right, the bathymetry of the Lucky Strike volcano with its crater at the centre, surrounded by three peaks.
Monitoring the Mid-Atlantic Ridge project
The Monitoring the Mid-Atlantic Ridge (MoMAR) project is a long-term multidisciplinary program created by the international InterRidge program in 1998, to study hydrothermal vents in the MAR (Colaço et al., 2011). As part of this project, in 2010 the EMSO-Azores marine observatory was deployed in the Lucky Strike volcano, devoted to the study of Mid-Ocean ridge processes, from the subseafloor to the water column.
The observatory is maintained every year during the MoMARSAT cruises, in which part of the instruments are recovered, serviced on board and redeployed, following the new objectives set for the next mission for the year to come. In particular, since the first deployment of the observatory, a mooring was placed Southeast of the Lucky Strike volcano and since then the mooring is serviced every year and deployed in the same region as the first one, although not in the exact location because the mooring is deployed from the surface, and it can drift horizontally while making its descent to the seafloor.
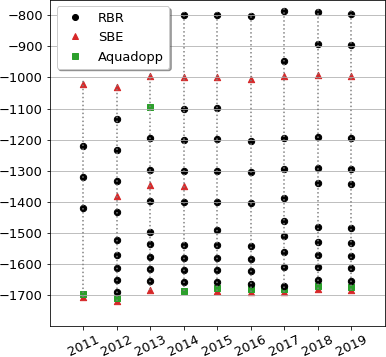
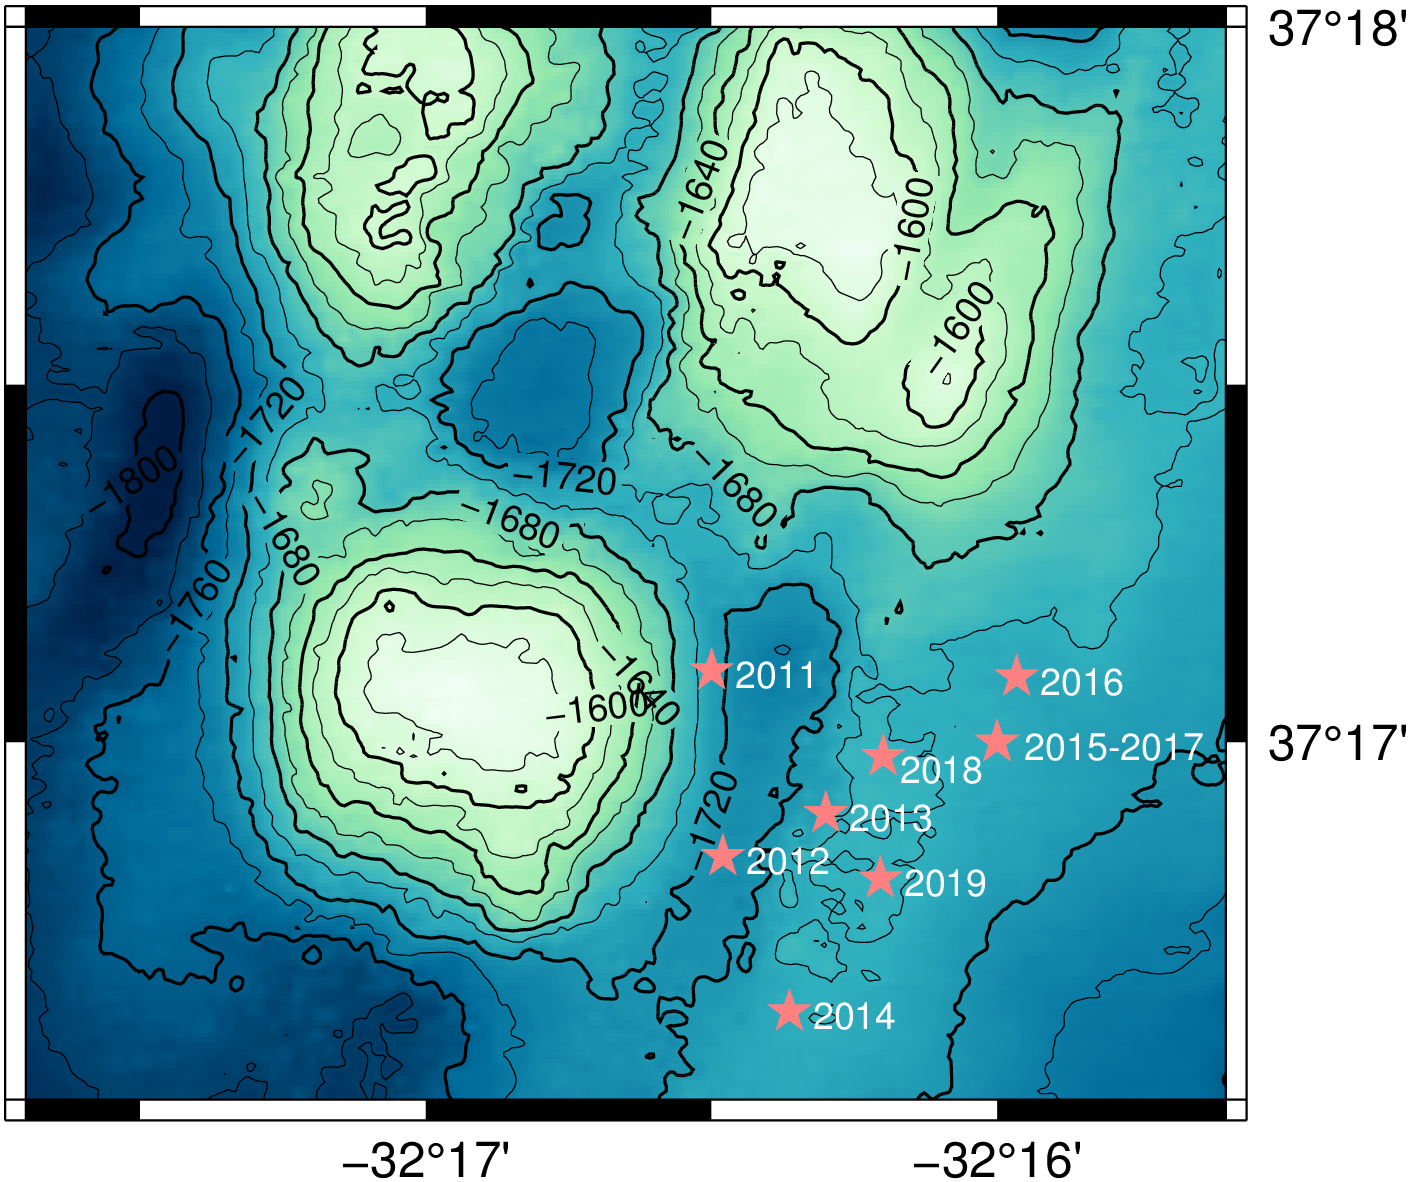
Figure 2: The mooring vertical and horizontal positions. The left panel shows the estimated real depth of all the instruments and the right panel shows the estimated location of the mooring, with respect to the Lucky Strike volcano. The pink stars indicate the position of the mooring each year.
The mooring used in this project is composed of three types of instruments: the RBR TR-1060 and RBR TR-1050 temperature recorders (referred as RBR), the SBE 37SM MicroCAT conductivity-temperature-pressure recorder (referred as SBE), and the Nortek AquaDopp single-point horizontal current metre (referred as AquaDopp). The RBRs have a sampling period of 3 min and it is the instrument that is predominant in the mooring, spanning from the top of the mooring down to the seafloor. The SBE is a fixed CTD. It was placed with constancy at −1000 m and −1700 m with some years in which a third SBE was placed at −1300 m, and it has a sampling period of 6 min. The AquaDopp has a sampling frequency of 6 min and measures the horizontal components of the velocity of the flow, it was placed 10 metres above the seafloor, except for 2013 when no AquaDopp was placed. The vertical position of the instruments in the mooring changed every year. In the left panel in Figure 2 is possible to see the different vertical configurations of the mooring throughout the 9 years of the campaign.
Methods
As part of the signal analysis, we estimated the power spectral density (PSD) of the signals recorded by the mooring’s instruments. The PSD gives information on how the signal is distributed into different discrete frequencies, and therefore it can be used for identifying the different forcings acting at a precise depth in the water column. A Fast Fourier transform (FFT) is used to convert the signal from a time domain into a frequency domain. From the different existing methods used to estimate the PSD, we used the Welch (1967) method because it yields a clean PSD curve with a high resolution in a determined frequency region.
Horizontal kinetic energy spectrum
It is convenient to compute the PSD of a signal to see the different forcings present at this particular location. We calculated this with the speed recorded with the AquaDopp instrument, obtaining the horizontal kinetic energy (HKE) spectra for all years with available data. To simplify the analysis, we selected the 2012 and 2017 HKE spectrum estimates, based on their similarity with the other years. These estimates are shown in Figure 3. We can classify the spectrum in frequency bands according to the type of motions occurring in the different time ranges. The first region corresponds to frequencies smaller than a period of 100 days for 2017 and 40 days for 2012. In this band, both curves display a nearly white flat band. The following band corresponds to the geostrophic eddy range and it is defined between the period 100 days up to the inertial frequency \(f\), which is the local Coriolis frequency defined as \(f = 2\Omega \sin \theta\). In this band, the HKE estimate falls in an approximate power law \(\sigma−b\) (where \(\sigma\) is the frequency and \(b\) is a constant), this band is geostrophically balanced, bellow the surface boundary layer. The internal waves band is located at frequencies between \(f < \sigma < N\) (where \(N\) is the Brunt-Vaisala frequency). This band follows as well an approximate power law and is controlled by gravity wave dynamics. Finally, the frequency band \(\sigma > N\) is dominated by small scale turbulence that results from the breaking of internal waves.


Figure 3: Horizontal kinetic energy (HKE) estimates recorded with the AquaDopp in 2012 (top) and 2017 (bottom). The labels at the top axis indicate the characteristic frequencies, in particular OO1 and K1 are the Lunar diurnal tidal components and M2, M4 and M6 are the semidiurnal components. N is the Brunt-Vaisala frequency at 1700m deep. The orange and blue lines indicate slopes correspond fit done for the geostrophic eddy band and the inertial wave band respectively. The dotted line with slope −5/3 is for comparison.
For both years, we see that both power spectra have clear peaks that correspond to the different tidal constituents, confirming that there is an amplification of the internal tide in the MORs as observed by Vic et al. (2018). In particular, just before the inertial frequency f there are peaks that match the lunar diurnal tidal frequencies K1 and OO1. Separating the geostrophic eddy band with the internal wave band, we see the inertial peak which is larger for 2012. In the internal wave band (\(\sigma > f\)) we see peaks that correspond to the internal tides. In particular, we see that the largest and broader peak coincides with the principal lunar semidiurnal constituent M2. Also, we identify the M4 and M6 semidiurnal peaks which contribute less to the HKE. At the higher frequencies, the resolution of the current meter doesn’t allow the spectrum to reach the \(N\) frequency where the breaking of the internal waves occurs. For both bands, the slope of the estimated power law is −1.02 for 2012 and −1.12 for 2017. The slopes in the internal wave band are −0.75 for 2012 and −0.74 for 2017, which are similar to the −0.81 slope reported by Ferrari and Wunsch (2009) and Fu et al. (1982) at 1500 m deep, 27°N in the MAR. The HKE from both years are similar in their estimated power laws, despite their slightly different topographical placing, suggesting that there is no variation between years.
Temperature Power Spectral Density Estimates
Following the same method used to compute the HKE, we calculated the power spectral estimates from the temperature sensors in the mooring. These sensors were predominant in the line throughout all years, making the temperature PSD estimates plots very numerous to display all in this section.
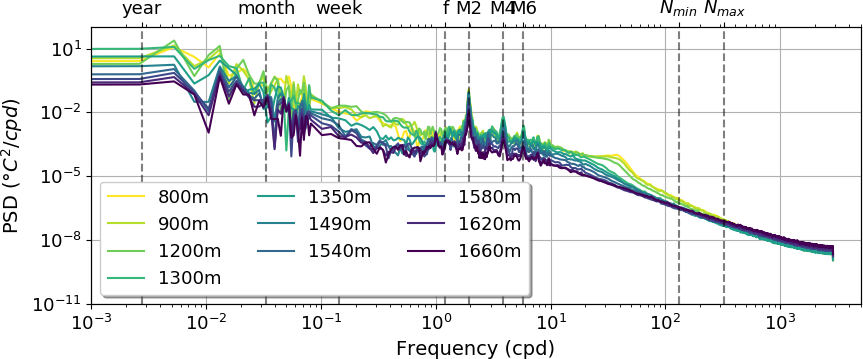
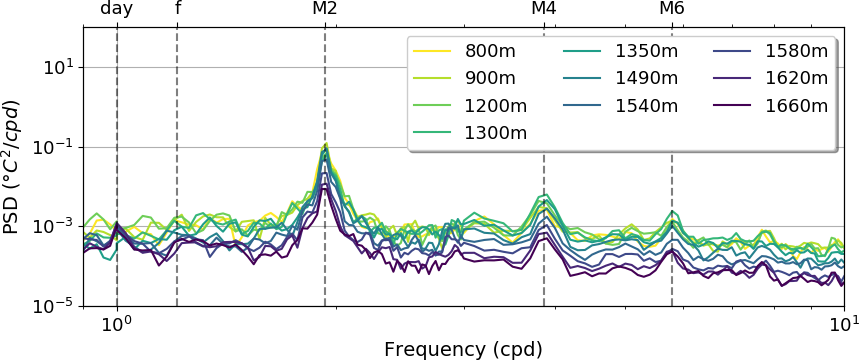
Figure 4: Temperature power spectral density recorded with the RBR in 2018. The top panel show the PSD from the time series recorded at −800 m down to the one at −1660 m. The lower panel is a zoom of of the top panel between \(1\) cpd to \(10^1\) cpd. Both plots mark the characteristic frequencies in the top axis.
We selected the 2018 measurements, recorded with an RBR, as a representative year for the temperature, because it had the largest number of sensors per depth installed in the line and it displayed a similar PSD from other years at the same levels. For this year, we estimated the PSD for all depths, which can be seen in Figure 4. At the top figure, we see how the different colors represent the PSD from different temperatures, and we note that the power of the signal decreases as the depth increases. In the geostrophic eddy band (\(\sigma < f\)), we see how the power spectra are larger for the shallower instruments such as −800 m to 1300 m, between \(10^{−1}\) cpd to \(1\) cpd, this might be due to the presence of mesoscale eddies, which structure can reach these depths. In the inertial band, we see that the spectrum is dominated by the M2 peak within the order of \(10^{−2}\) º\(C^2/cpd\), followed by the M4 and M6 peaks, decreasing in power as frequency increases. The Nmin and Nmax are the Brunt-Vaisala frequencies for the bottom depth (−1600m) and the top depth (−800m) respectively. Between these two frequencies, we don’t see the signature of wave breaking, instead, we see a continuous decaying of the spectrum and a convergence of all the PSDs. Although, in the frequency range \(10^1\) cpd to \(10^2\) cpd, we see the broad peak at \(38\) cpd for depths of 800 m, 900 m and 1200 m, being smoothed as the depth increases. In the bottom panel of Figure 4, we see a zoom at the lower spectrum of the inertial frequency band. Between the semidiurnal peaks, we see that the PSD estimates have a higher value for the shallower measurements than for the deeper ones, this is due to the friction from the seafloor that slows the water movements. Also, there is no inertial peak at \(\sigma ∼ f\) and the lunar diurnal peaks are also not present.
Acknowledgments
Thanks to Prof. Guillaume Roullet and Dr. Jonathan Gula for supervising me during this work. This post it’s just an excerpt of my master thesis.
References
- Colaço, A., Blandin, J., Cannat, M., Carval, T., Chavagnac, V., Connelly, D., Fabian, M., Ghiron, S., Goslin, J., Miranda, J., et al. (2011). Momar-d: a technological challenge to monitor the dynamics of the lucky strike vent ecosystem. ICES Journal of Marine Science, 68(2):416–424.
- Ferrari, R. and Wunsch, C. (2009). Ocean circulation kinetic energy: Reservoirs, sources, and sinks. Annual Review of Fluid Mechanics, 41.
- Fu, L., LL, F., PP, N., et al. (1982). Observations of mesoscale variability in the western north atlantic: A comparative study.
- Jean-Baptiste, P., Fourré, E., Dapoigny, A., Charlou, J.-L., and Donval, J.-P. (2008). Deepwater mantle 3he plumes over the northern mid-atlantic ridge (36° n–40° n) and the azores platform. Geochemistry, Geophysics, Geosystems, 9(3).
- Karson, J. A., Kelley, D. S., Fornari, D. J., Perfit, M. R., and Shank, T. M. (2015). Dis- covering the Deep: A Photographic Atlas of the Seafloor and Ocean Crust. Cambridge University Press.
- Langmuir, C., Humphris, S., Fomari, D., Van Dover, C., K., V. D., Tivey, M., Colodner, D., Desonie, J.-L. C. D., et al. (1997). Hydrothermal vents near a mantle hot spot: the lucky strike vent field at 370n on the mid-atlantic ridge. Earth and Planetary Science Letters, 48:69–91.
- Ondréas, H., Cannat, M., Fouquet, Y., Normand, A., Sarradin, P.-M., and Sarrazin, J. (2009). Recent volcanic events and the distribution of hydrothermal venting at the lucky strike hydrothermal field, mid-atlantic ridge. Geochemistry, Geophysics, Geosystems, 10(2).
- Vic, C., Gula, J., Roullet, G., and Pradillon, F. (2018). Dispersion of deep-sea hy- drothermal vent effluents and larvae by submesoscale and tidal currents. Deep Sea Research Part I: Oceanographic Research Papers, 133:1–18.
- Welch, P. (1967). The use of fast fourier transform for the estimation of power spec- tra: a method based on time averaging over short, modified periodograms. IEEE Transactions on audio and electroacoustics, 15(2):70–73.